
Project Overview

Performance Results
Background
Our client is a recognized leader in the raw pet foods marketplace. They pride themselves on producing minimally processed, protein-packed, and never cooked dog and cat foods that preserve the integrity of every ingredient.
With twenty years of crafting and perfecting its raw recipes, our client is on a mission to put more ‘raw’ in more bowls to transform the lives of pets.
Along with its decades-long success came customer demand challenges revealing an opportunity to improve supply chain best practices and inventory control.
Discovery
The POWERS team worked on-site with our client’s supply chain team at their corporate headquarters and manufacturing sites to review current processes and identify the current state of the supply chain.
The main purpose was to evaluate supply chain best practices for determining the appropriate working capital levels and define supply chain best practices to optimize the levels while maintaining a good service level for the key SKUs.
The Sales and Operations Planning (S&OP) process is the generally accepted approach for managing demand. The process will yield optimized forecast accuracy, inventory, and customer service when used appropriately.
After Engaging POWERS and Installing Supply Chain Best Practices
Comprehensive and collaborative ABC Product Segmentation cadence
Increased visibility of co-packer and internal manufacturing constraints
Revised S&OP cycle implementing a strategic approach
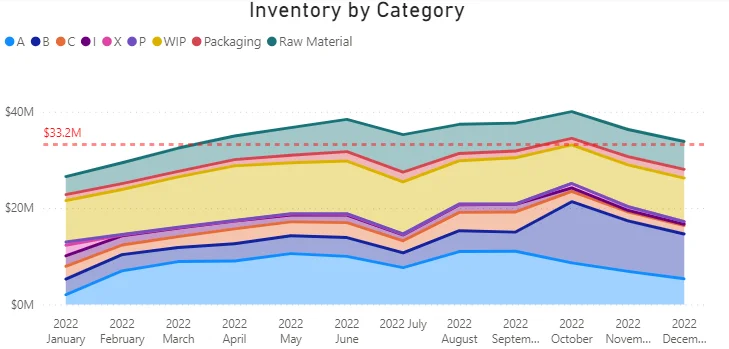
Developed Power BI Dashboards that were used during the E-SOP meeting
Increased focus on highest revenue/volume SKUs
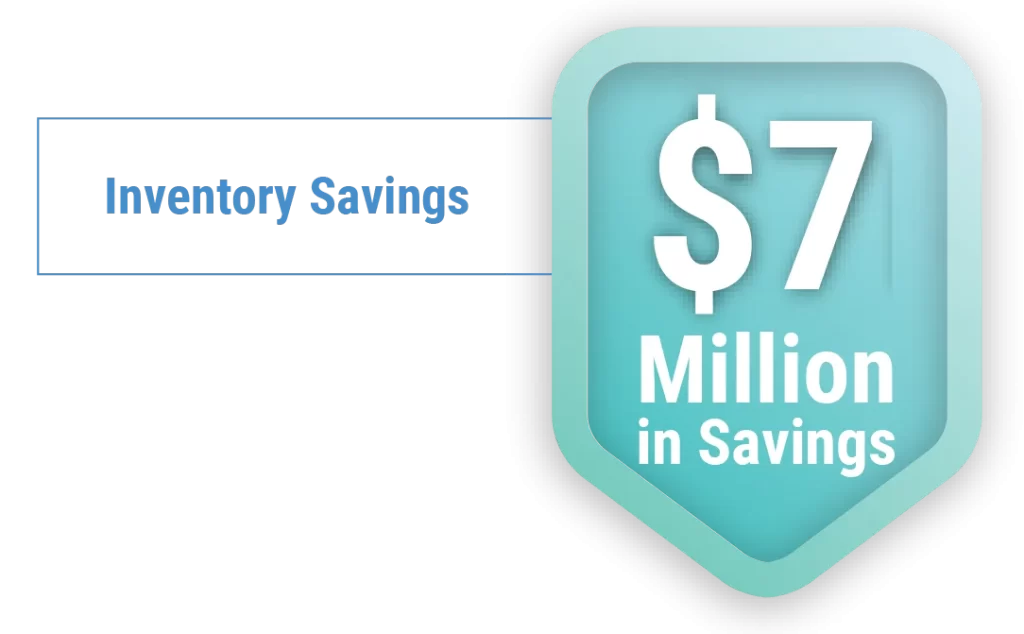
20% Reduction of working capital (FP inventory)
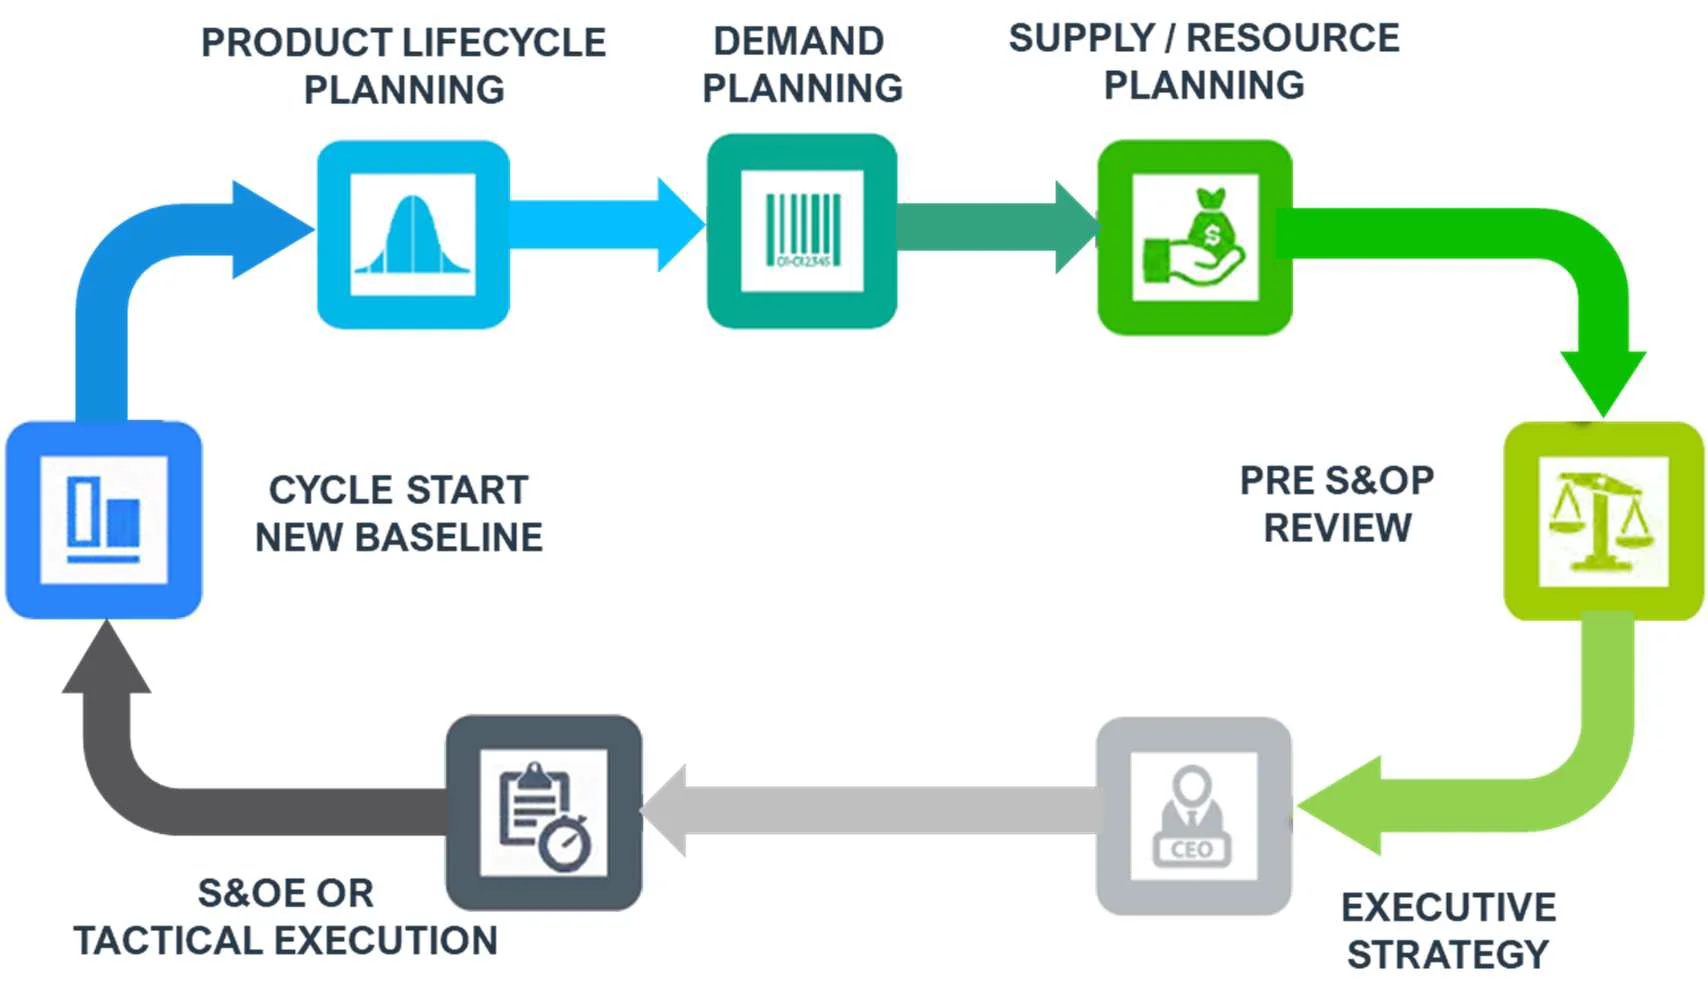
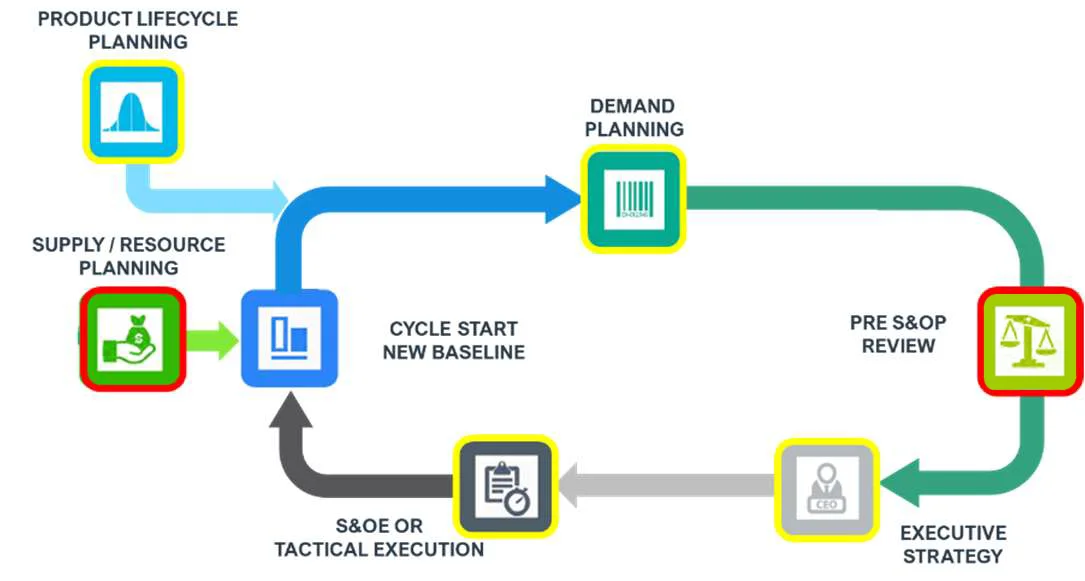
During the discovery process, the S&OP process was evaluated for having all the necessary processes and illustrated for completeness.
- RED - Not in place
- YELLOW - In place, however, needs improvement
- GREEN - Installed, complete, and in place
Analysis
The POWERS team uncovered that our client’s S&OP process required significant improvement as follows:
Demand Planning (Yellow) - The demand planning process discusses the initial forecast demand between the sales channel directors and the supply chain team. The supply chain team prepares the statistical forecast using a state-of-the-art forecast application (Smoothie by Demand Works) and presents the information to each channel director. In this process, a final aggregate analysis is only presented at the executive strategy meeting (Demand Consensus Meeting). The CEO, CFO, and other members of the SLT (Senior Leadership Team) attend the Demand Consensus Meeting.
Supply Resource Planning (Red) - The supply resource planning needs more feedback to the S&OP process as no constrained plan is developed and agreed between the supply chain and operations. The co-packers receive a forecast from Instinct's Supply Chain. Every month a PO is issued to the co-packers, and their feedback on these purchase orders is used to present a back-order projection to allocate the finished product. A major missing part is an agreed 12-month rolling constrained supply plan that must be uploaded into the system to adjust revenue projections based on constraints (personnel, material, machine, and other resources).
Pre-S&OP Review (Red) - As mentioned previously, there is no Pre-SOP meeting where the sales channel directors can review the aggregate demand consensus and the constraints from operations and co-packers that could affect the service rate and overall revenue. The aggregate results of the forecast/demand discussions are presented at the Demand Consensus with the SLT. This is a significant gap that creates a collaborative ownership approach.
Executive Strategy (Yellow) - The demand consensus presented to the executive team lacks the operation feedback. A projected fill rate is given, adjusting the projected revenue. In addition, there is a great focus on the current AOP (Annual Operating plan or year running budget) and a lack of visibility and discussion of on-demand plan or supply constraints with a rolling 12-month projection.
S&OE Tactical Execution (Yellow) - During the execution of the plan, the supplier purchase orders and production work orders are formed in the ERP system. The performance of the suppliers is not measured to adjust the approach. The team relies on experience and tribal knowledge to adjust actions to mitigate supply risks.
Product Lifecycle (Yellow) - A SKU segmentation is updated annually by the commercial team. The supply chain uses this segmentation to calculate safety stock for the finished product. The percentage used in the calculation (Input FR) has no statistical difference (See Table 1 - Segmentation), and the timing of the segmentation needs to be better defined. With AOP development starting soon, there has yet to be a segmentation cadence in preparing for the budget cycle.
Table 1
Overall, the S&OP processes, decision-making, and actions needed to improve visibility, collaboration, and reporting-up. The discussions, decisions, and actions between demand plans, supply constraints, and finance requirements must be comprehensive and visible to all the stakeholders and the different levels of the organization. The lack of visibility and visibility cadence generated a disconnect among the team and reduced stakeholder collaboration and ownership.
Approach
- Assess current state of S&OP vs. best practice S&OP
- Create an action plan around core initiatives to close the gap between “as is” and future state S&OP
- Understand general gross $ Inventory value impact
- Refine $ impact as key process initiatives are in place
- Create sustainable policies/ownership around each process
S&OP Process - Develop process, policy, and cadence to present the discussions and actions from the forecast, demand plan, supply constraint evaluations, and the different interactions and collaborations from the sales, supply chain, and ops director levels. This will include a Pre-S&OP meeting to present aggregates of demand, supply plans, and adjustments and an Executive S&OP meeting to explain the agreements and actions taken to the SLT members.
Product Lifecycle - Develop consensus, policy, and cadence for product segmentation and product lifecycle actions and develop reports to increase the visibility and visibility of the impact of the product lifecycle on the overall performance and revenue.
Demand Plan - Adjust the approach to include a handshake milestone on the process that will consist of presenting and agreeing on aggregates of demand plan, supply evaluation, inventories, and fill rate projections. The goal is to strike a balance between having sufficient inventory levels to meet customer needs without having a surplus at the end of the cycle.
Resource Planning - Develop a 12-month supply plan that considers any constraints (personnel, material, machine, and other resources) from internal operations and co-packers and use it to adjust the overall demand/supply, reports, and consequently to project fill rate, revenue, and inventories accurately.
Ops Inventory Accuracy - Initiative targeted at the ops department in Lincoln, NE, to improve inventory accuracy by ensuring the transaction is completed at the source of the action during the process.
Value Stream Mapping - Operations Lean Initiative to analyze the current state and designing a future state for the series of events that take a product from the beginning of the specific process until it reaches the finished product state and the distribution center.
Supplier Analysis - Develop DIFOT (Deliver in full on time) performance ratings for suppliers that will also be used in risk analysis. These ratings will also create a different approach to suppliers based on reliability performance (credit rating, payment terms, contracts, alternate, and more).
Inventory Targets - Once all the process improvements are installed, calculate safety and cycle stock inventory targets. Develop cadence based on product segmentation, variation of demand, risk of supply and target service levels.
Results
- Comprehensive and collaborative ABC Product Segmentation cadence
- Increased visibility of co-packer and internal manufacturing constraints
- Revised S&OP cycle implementing a strategic approach
- Developed Power BI Dashboards that were used during the E-SOP meeting
- Increased focus on highest revenue/volume SKUs
- 20% Reduction of working capital (FP inventory)
