POWERS Leads Production and Maintenance Transformation of World-Class, Family-Owned Meat Processor Looking to Improve Throughput and Capitalize on Massive Demand.

Project Overview

Performance Results
POWERS partnered with a world-class, 7th generation family-owned and operated meat processing company that uses only real, natural ingredients, original recipes, and time-honored traditions to create distinctive and timeless products. Unable to meet historical demand levels, they looked for a drastic increase in throughput.
They had extended their lead times to receive raw material and to fill customer orders. They also reduced their product offerings to assist throughput and efficiencies yet still worked 24/7 to meet demand. This schedule pressure created high employee burnout, absenteeism, and turnover, leaving them short-staffed in critical production and maintenance positions.
Skilled labor in the surrounding area was in high demand and required increasing competitive wages. But, if they could develop a solution to their throughput issues and increase yield, the financial opportunities would be tremendous.
The POWERS team was brought in to analyze the issues, then formulate and rapidly execute a plan to turn the business around and capture the market opportunity.

Our Approach
We identified and quantified any opportunities to improve operations processes, systems and methods, and leadership and management behavior effectiveness through detailed analysis and time spent with frontline leaders on the shop floor.
We developed an approach that addressed these opportunities and improved deficiencies and poor performance in Production and Maintenance that helped our client achieve their vision for their organization and transform performance.

Project Overview
POWERS partnered with a world-class, 7th generation family-owned and operated meat processing company that uses only real, natural ingredients, original recipes, and time-honored traditions to create distinctive and timeless products. Unable to meet historical demand levels, they looked for a drastic increase in throughput.
They had extended their lead times to receive raw material and to fill customer orders. They also reduced their product offerings to assist throughput and efficiencies yet still worked 24/7 to meet demand. This schedule pressure created high employee burnout, absenteeism, and turnover, leaving them short-staffed in critical production and maintenance positions.
Skilled labor in the surrounding area was in high demand and required increasing competitive wages. But, if they could develop a solution to their throughput issues and increase yield, the financial opportunities would be tremendous.
The POWERS team was brought in to analyze the issues, formulate and rapidly execute a plan to turn the business around, and capture the market opportunity.
Our Approach
We identified and quantified opportunities to improve operations processes, systems and methods, and leadership and management behavior effectiveness through detailed analysis and time spent with frontline leaders on the shop floor.
We developed an approach that addressed these opportunities and improved deficiencies and poor performance in Production and Maintenance that helped our Partner achieve their vision for their organization.
Analysis
We worked with the crew to determine the current operating reporting systems, volumes and standards, capacities, line configurations, and improvement opportunities in their respective areas. We conducted observations to test the validity of performance targets and compared performance to Accounting Standards, Scheduling Standards, and observed capacity based on current operating conditions. We asked each of the supervisors and managers to critique their existing systems. An evaluation of the Management Operating Systems was conducted by first determining the existence of the system elements. Second, by evaluating how well they are being utilized by management to plan work and resolve operating problems that occur during the execution of that work.
Based on our behavioral analysis, supervisors indicate that they spend most of their time in Supervisory Activity (29%) and an average of 11% of their time in Problem Solving activity. However, our observations were that only 3% of the time was spent in active Supervision, and 45% was spent on administrative activities, which consisted mainly of being off the production floor.
The diagnostic assessment was segmented by Production Manager(s) and Supervisor level. All levels demonstrated a marginal understanding of the essential supervisory concepts. These missing leadership traits and behaviors needed to be strengthened.
The detailed studies and observations of the activities revealed significant opportunities to improve operational performance. We uncovered excessive amounts of obvious and hidden lost time. The lost time manifested itself in poor startups, poorly sequenced setup and change-over activity, production variances, pacing, and inadequate activity definitions that led to varying methods. The timeliness of reporting to determine productivity issues did not allow for effective follow-up or reaction to operating problems that caused excessive costs. Timely reports did not roll up accurately, thereby presenting false operating views.
Opportunities For Improvement Uncovered in PRODUCTION and MAINTENANCE
PRODUCTION
The capacity of high-value production lines was less than 50%, and the reasons for the downtime were unclear. Downtime reasons tracking was not standardized across production lines.
Processes
- Ineffective and inefficient onboarding of operators and supervisors "on-the-job."
- Ineffective operator job qualifications to set up equipment
- Inadequate skill flexibility management for operators
- Ineffective expectations to handle cut-offs, increase waste, manage and reduce inedible product
- Unclear expectations and training for operators to troubleshoot equipment
- Inefficient process for rack management leads to schedule changes and improper product storage
- Unclear startup, set-up, and end-of-shift expectations
- Lack of robust FIFO materials aging management causes schedule changes and production delays
- Ineffective expectations for Maintenance support during startup
Systems
- Ineffective review and evaluation of key performance indicators
- Non-existing visibility of key performance indicators at the floor level
- Inadequate accountability for inedible product
- Operators' skill qualifications were not easily visible to supervisors
- Lack of visibility of production schedule to the maintenance department to schedule their work
- Ineffective spare parts management leads to equipment running at lower rates and rework
- Lack of Maximo training for operations supervisors creates an inefficient entry of service requests
Behaviors
- Unclear expectations for effective and frequent supervisory follow up during production runs
- Lack of accountability for excessive breaks, late starts, and early finishes
- Excessive time is spent on administrative duties pulling supervisors off the floor
- Lack of ability to focus on permanent problem resolution - the root cause
- 'EMT' reactive actions to 'emergencies' - wait and be ready.'
- Walking the floor without specific objectives and purpose
- Teamwork and coordination missing between shifts and with support functions - Production and Maintenance; setting the next shift up for success
- Supervisors scheduling their areas - attempts are reasonable
MAINTENANCE
Systems
- CMMS (Maximo) was not set up correctly when installed
- The scheduling function is not used in Maximo
- Ineffective review of service requests
- Maintenance was alerted of any service requests entered by email
- The majority of work orders were entered by maintenance mechanics (reactive)
- Planned/unplanned work is not effectively reported or reviewed
- Downtime reporting is incomplete, random and integrity is questionable
- KPI reports do not exist
- Backlog is not managed
- Estimated hours on most jobs are non-existent
- Assigning of work to mechanics is done electronically vs. interactive and two-way.
- Lack of completed work reporting
- Duplicate PM work orders
- Frequency on PM's needs evaluation
- Questions on current asset listing - update
- "Blanket" (startup) work orders need to be rationalized
Processes
- Lack of identified asset criticality aligned with business priorities (outside of tribal knowledge)
- Assignment of work is through email, lack of formal assignment
- No expectations set for performance - time standards (estimates), quality (bandages vs. permanent)
- Most unplanned work is input by the mechanic at the end of the shift
- No formal maintenance and production coordination
- Minimal engagement in Production daily/weekly scheduling and planning process to identified or secure equipment access
- No formal review of root causes of downtime/breakdowns - postmortem of majors driving changes in PM content, frequency
- Review of 'common/identical/same' equipment is not required when failures occur to identify potential risks
Behaviors
- Roles and responsibilities are not clearly defined. For example, the planner is referred to as the "parts guy." Supervisor feedback, "am I supposed to follow up on the work?"
- Lack of accurate skills/flex matrix for the mechanics
- No supervisor training
- Minimal interaction with mechanics unless it is an emergency
- Lack of standard work, which contributes to a very reactionary department
- Lack of follow-up on work to determine variances, mechanics needs, parts requirements, skill requirements.
- Mechanics are self-directed most of their days - leading mechanics to select what they work on and when.
- Lack of accountability to MRO part management - mechanics and part users/takers - lack of security
Our Process
Our Partner's organization had a total of eight departments. We started with two departments with the high-value and high-volume production lines and used them as our sandbox to develop the key MOS elements to install company-wide. After these two departments had gained some traction, we added new departments to the implementation schedule every two weeks.
The first step on the approach was to develop a list of "Quick Wins" to implement in the first 4-8 weeks and gain momentum. We started with goal alignment, timely startups, adjustment of start times, address early punches, pre, and post-shift meetings, shift hand-off, clean up maintenance backlog, clean up PMs (tasks/frequency).
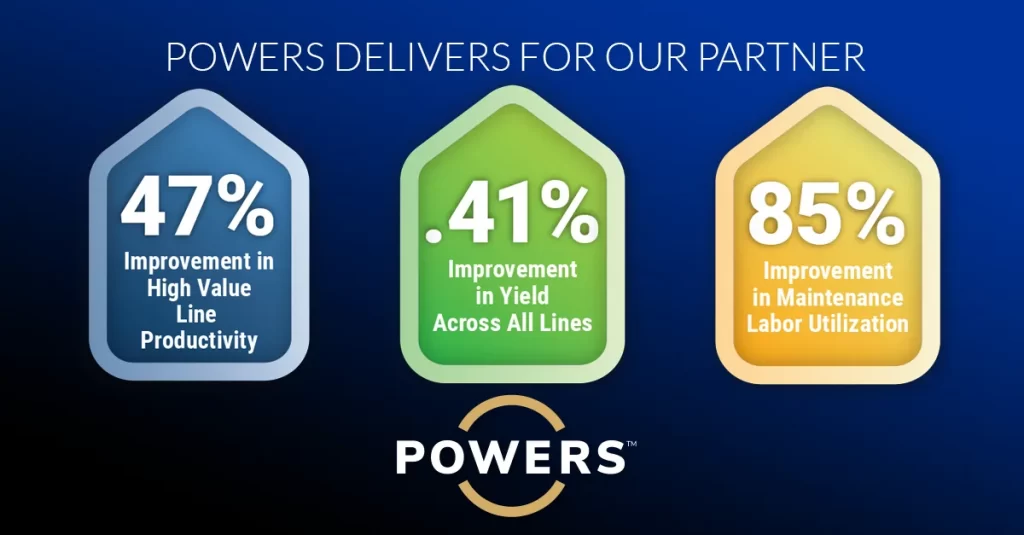
A Quick Win that accelerated improvement was setting the expectations of timely startup times and making line balancing changes to achieve these expectations. This new process helped obtain significant improvements in productivity within a few days. In about eight weeks, throughput in a high-value line of sliced meats increased by 47%.
We also identified the MOS elements that were non-existing or needed to be upgraded during the discovery phase. We then developed an implementation plan for the first eight weeks of the project to install these missing elements with frequent iterations from the client. As a result, by week eight, all key MOS elements were installed in Production. By week twelve, we had installed the elements in Maintenance.
By week five, we had already implemented a Production Loss Accounting System (their IT group helped identify the best third-party application to purchase and use for this task). This system allowed us to begin tracking downtime sources and time lost and create the initial reports to discuss during performance review meetings.
We developed a complete list of KPIs and their definitions during these initial weeks, and efforts to create a robust Power BI reporting tool also started.
Performance Results
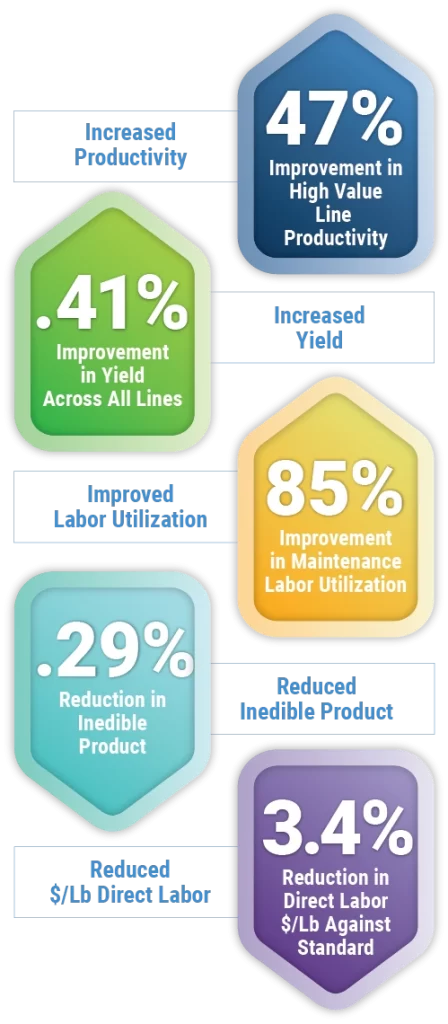
Beyond management having timely KPIs and information readily available for critical decision-making, their frontline leaders were more engaged, with full support from executive management. Their Maintenance department was transformed with good CMMS information and reporting, PMs rationalized, a "Maintenance Labor Utilization" higher than 85%, and real-time Maintenance KPIs.
Other significant improvements in Production include:
- Improved productivity in high-value line by 47%
- Improved yield by 0.41%
- Reduced inedible product by 0.29%
- Reduced Direct Labor $ per Lb. by 3.4 % below standard


